Adjusting the Memory Limit
HRC dynamically allocates memory based on your system's resources. You can fine-tune this to optimize performance. To adjust the memory limit, follow these steps:
-
Locate the hrc.ini file in the installation directory.
- Windows: Right-click the HRC launcher, select Properties, and then Open File Location.
-
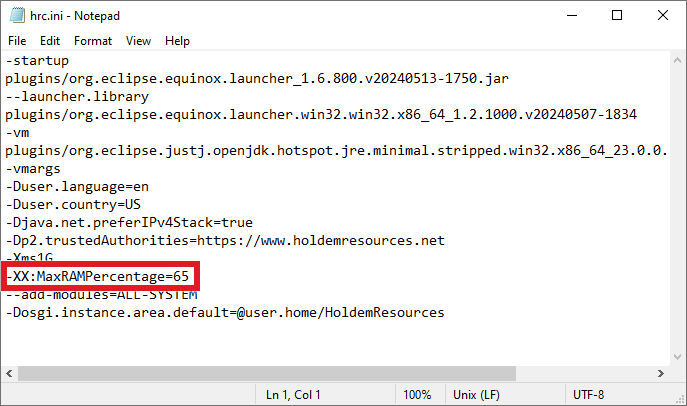
Open hrc.ini in a text editor and find the -XX:MaxRAMPercentage setting near the end of the file.
-
Update the -XX:MaxRAMPercentage value as needed.
- For instance, to set the limit to 80% of physical memory, change the line to
-XX:MaxRAMPercentage=80.
- Exercise caution: Don't exceed the recommended upper limit for your system's physical memory to ensure enough memory remains available for other applications.
Physical
RAM | MaxRAMPercentage
Upper Limit |
|---|
| 8GB | 75% |
| 16GB | 80% |
| 32GB | 85% |
| 64GB | 88% |
| 128GB | 90% |
| 256GB | 93% |
| 512GB | 95% |
| >=1TB | 95% |
Caution: Do not set MaxRAMPercentage above 95% under any circumstances, as this may lead to performance or stability issues.
-
Save hrc.ini and restart HRC.
Older Versions: The -Xmx Setting
Previous versions of HRC used the -Xmx setting to define the memory limit directly.
- Example:
-Xmx4G sets the limit to 4GB of RAM.
While the -Xmx option is still supported, if both -Xmx and -XX:MaxRAMPercentage settings are present, -Xmx takes precedence. If you previously customized your memory settings with -Xmx, you must remove this setting from your hrc.ini file to use the new percentage-based allocation.
Monitoring Memory Usage in HRC
Incorrect memory limit configurations can cause problems. HRC runs within a Java Virtual Machine (JVM), which allocates and manages memory.
You can monitor live heap usage in HRC using the status bar in the bottom right corner:

- When no calculations are actively running, click the garbage can icon to trigger garbage collection.
- This clears temporary data and displays the remaining memory usage of loaded hands, abstractions, and so on.
- Manual garbage collection is for informational purposes, as it's performed automatically when needed.
- Hovering over the status bar displays additional information.
- The example shows HRC using 892MB of heap space out of 2376MB allocated by the JVM.
- The memory limit is 4096MB (4GB), and the JVM could allocate additional memory up to that limit if needed.
During sampling, the memory status will behave like this:

- The bar should constantly fill and then jump back—this is normal.
- Temporary data is created during calculation and later cleared.
- As long as the bar occasionally clears below 80-85%, things are fine.
Troubleshooting Memory Issues
Memory issues in HRC can typically be categorized into three types:
- HRC runs out of space within the JVM (hitting the memory limit)
- The memory status bar gets stuck towards the maximum, and HRC may display memory-related error messages. This is the most common cause of problems.
- Java fails to allocate more space (memory limit is set too high)
- If HRC closes without an error message and creates crash log files in the HRC directory (
hs_err_pid*.log), then the JVM likely fails to allocate additional memory.
- Hardware failures or instabilities
- While less common, hardware issues can also cause crashes without an error message.
Let's explore each of these scenarios in more detail.
HRC Runs Out of JVM Heap Space
The most common issue is HRC exhausting the maximum heap space allowed by the memory limit setting.

- Typical Indicators:
- Error messages like "Out of memory exception" or "Insufficient heap space".
- Seemingly unrelated errors like "Nullpointer exceptions".
- The memory status bar gets stuck at well over 95% and barely moves.
- Explanation:
- The JVM is not allowed to allocate additional memory due to the memory limit setting.
- All space within the JVM is occupied by non-temporary data that can't be cleared by the garbage collector.
- Java keeps running garbage collections in an attempt to clear space, and HRC may become unresponsive.
- Options to fix this:
- Free up space within HRC by closing open hands.
- Reduce the tree complexity, e.g., by using fewer and larger bet sizes.
- Increase the memory limit if sufficient RAM is available on your system.
Tip: Aim to keep about 15% of heap space free to maintain peak performance and avoid potential stability issues; otherwise, HRC's performance may be slightly impacted.
JVM Is Unable to Allocate Additional Memory
The JVM reserves memory from the operating system up to the limit you specified.
- Potential Issues:
- If it tries to allocate more memory than is physically available, this can cause the JVM to shut down (HRC "crashes" without an error message).
- The operating system may try to make room for HRC by killing other processes or starting to swap. It's best to avoid this scenario.
- Recommendations:
- Ensure that the specified memory limit is actually available and leaves enough room for your operating system and other programs.
- HRC will use some additional memory on top of the specified heap limit, so reserve at least 1-2 GB extra space.
- It's better to stay on the conservative side with the memory limit to avoid any issues.
Hardware Stability Issues
If you've ruled out the issues above and HRC continues to crash, this may result from a hardware issue.
- Troubleshooting Steps:
- Try running stress tests to check for hardware stability problems.
- Prime95: Can quickly identify CPU instabilities, which could result from faulty hardware, insufficient cooling, incorrect BIOS configuration, or unstable overclocking.
- Memtest86+: For a more in-depth memory test.